
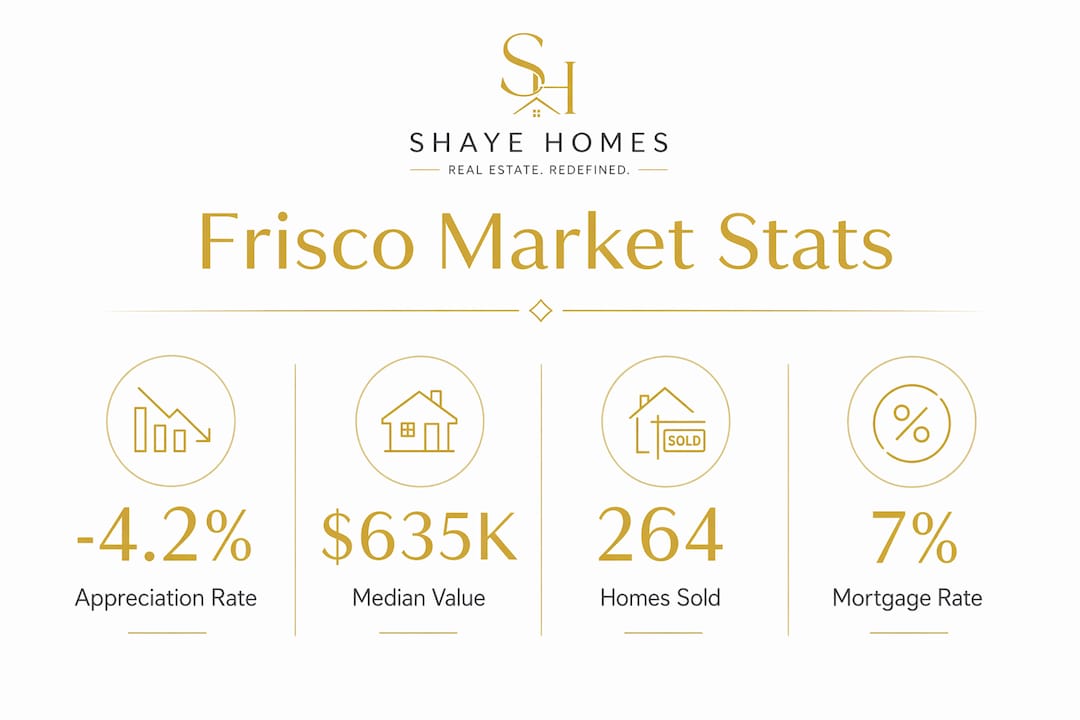
The Frisco home appreciation rate is currently negative, sitting at a 4.2% year-over-year decline as of february 2026, with a median home value of $635,704. That number tells only part of the story. Prices have fallen for 12 consecutive months, dropping roughly $28,200 from the March 2025 peak, yet Frisco’s long-term fundamentals remain among the strongest in North Texas. For buyers and investors trying to time this market, the real question is not whether prices fell but whether the forces driving long-term property appreciation in Frisco still hold. They do, and this guide explains exactly why.
What is the Frisco home appreciation rate right now?
The industry term for what most buyers search is residential price appreciation, measured as the percentage change in median home value over a defined period, typically 12 months. In Frisco, that figure is currently negative. The 12-month price decline of 4.2% places the median at $635,704 as of february 2026, down from a peak near $663,900 in early 2025.
Despite that correction, the market is not stagnant. 264 homes sold in Frisco in May 2026, up from 226 in the same month the prior year. Volume rising while prices fall is a classic sign of a market finding its floor, not collapsing. Buyers are still active; they are simply paying less per home than they would have 18 months ago.

For investors, the distinction matters. A correction in a fundamentally strong market is different from structural decline. Frisco sits firmly in the first category.
What caused the recent decline in Frisco home value?
Three forces converged to push Frisco home values lower through 2025 and into 2026.
Supply finally caught up with demand
Frisco added significant new construction inventory over the past two years. When supply increases faster than buyer absorption, prices adjust downward. That is precisely what happened here. The correction is not demand destruction; it is a supply-driven reset after years of undersupply.
Mortgage costs reduced purchasing power
At a 7% interest rate, monthly payments on a $635,000 home run roughly $185 lower than they did at the 2025 price peak, according to affordability calculations from HousingData.report. That sounds counterintuitive until you realize buyers are qualifying for less. Higher rates compress the price ceiling buyers can reach, which pulls median values down even when demand stays steady.
Monthly data confirms a gradual, not sudden, correction
The table below shows how median values shifted across the correction period.
| Period | Estimated Median Value | Month-over-Month Change |
|---|---|---|
| March 2025 (peak) | $663,900 | Baseline |
| June 2025 | $651,000 | Down ~1.9% |
| September 2025 | $643,000 | Down ~1.2% |
| December 2025 | $638,000 | Down ~0.8% |
| February 2026 | $635,704 | Down ~0.4% |
The pace of decline is slowing. That pattern typically precedes stabilization.
Pro Tip: If you are financing a purchase, run your affordability numbers at both 6.5% and 7.5% to stress-test your budget before you make an offer. Rate swings of even half a point change your monthly payment by hundreds of dollars on a $600,000 home.
How do Frisco home appreciation rates vary by neighborhood?
Frisco is not a single market. It is four distinct ZIP code markets with meaningfully different price levels and appreciation trajectories. Understanding this is how serious buyers and investors find value others miss.
ZIP code price comparison
Median prices range from $564,249 in ZIP 75036 to $667,986 in 75034, a spread of more than $100,000 within the same city. That gap reflects differences in home age, lot size, school feeder patterns, and proximity to major employers.
| ZIP Code | Median Home Value | Trend Direction | Price Tier |
|---|---|---|---|
| 75034 | $667,986 | Declining | Upper |
| 75033 | $641,000 | Declining | Mid-upper |
| 75035 | $628,000 | Declining | Mid |
| 75036 | $564,249 | Declining | Entry |
All four ZIP codes trended downward together, confirming the correction is market-wide rather than isolated to specific neighborhoods. However, the rate of decline differs. Entry-level ZIP codes like 75036 tend to hold volume better because more buyers qualify at lower price points.
Key factors that separate stronger-performing pockets within Frisco include:
- School feeder assignments. Homes zoned to Frisco ISD’s top-rated campuses command consistent premiums regardless of broader market direction.
- Age of construction. Newer builds in master-planned communities carry builder warranties and modern floor plans that retain buyer interest longer.
- Proximity to the PGA Frisco campus and Toyota Stadium. These anchors drive employer traffic and short-term rental interest in surrounding neighborhoods.
For a detailed look at how specific communities within the broader area perform, the Star Trail appreciation analysis from Kamilashayehomes breaks down neighborhood-level data worth reviewing before you narrow your search.
What are the long-term drivers of Frisco real estate growth?
Short-term corrections do not erase long-term fundamentals. Frisco’s appreciation story over the past decade is one of the strongest in Texas, and the structural drivers behind it remain intact.
Population growth that outpaces most American cities
Frisco’s population grew 92% between 2010 and 2023, reaching 225,007 residents. That is not organic growth. It is the result of deliberate city planning, corporate relocations, and a quality-of-life profile that attracts high-income households from across the country. Population growth at that scale creates sustained housing demand that absorbs new supply over time.
A decade of price appreciation that resets expectations
Median home prices rose from $300,000 in 2013 to $680,000 in 2023, a 127% increase over ten years. The current correction brings values back roughly 6.5% from that 2023 peak. Buyers entering now are not buying at the bottom of a failed market. They are buying after a modest pullback in a city that tripled its population and more than doubled its home values within a single decade.
The long-term drivers supporting continued Frisco home value increase include:
- Frisco ISD rankings. Consistently rated among the top school districts in Texas, Frisco ISD is a primary relocation driver for families moving from California, Illinois, and the Northeast.
- Corporate anchor employers. The PGA of America headquarters, Toyota’s North American campus in nearby Plano, and a dense concentration of financial services firms create stable, high-income employment within commuting range.
- City planning infrastructure. The Frisco 2025-2029 Consolidated Plan explicitly identifies school quality, amenity investment, and population growth as pillars of sustained housing demand.
- Retail and entertainment density. Stonebriar Centre, the Ford Center at The Star, and PGA Frisco create a live-work-play environment that commands price premiums in surrounding residential areas.
Pro Tip: When evaluating long-term appreciation potential, look at the employer base within a 20-minute drive of any home you consider. In Frisco, that radius includes thousands of corporate jobs that generate consistent relocation demand year after year.
How does Frisco compare to nearby North Texas markets?
Context matters when evaluating any local market. Frisco’s current 4.2% year-over-year decline looks different when you place it alongside neighboring cities.
Prosper and Celina, both north of Frisco along the US-380 corridor, experienced similar supply-driven corrections but at different magnitudes. Celina, which is earlier in its development cycle, saw less severe price pressure because its new construction pipeline is still absorbing first-time buyers priced out of Frisco. Prosper, positioned as a premium alternative to Frisco, held values slightly better due to lower inventory relative to demand.
Across Texas broadly, the correction in Frisco contrasts with markets like Austin and San Antonio, which experienced sharper declines of 8%–12% from their respective peaks. Frisco’s correction is moderate by comparison, which reflects the depth of its demand base.
Key comparative takeaways for investors:
- Frisco offers more established infrastructure than Celina, which reduces development risk for buyers seeking immediate rental income.
- Prosper’s premium positioning means fewer entry-level opportunities but stronger price floors in the $700,000-plus tier.
- The broader North Dallas corridor, including Frisco, Allen, and McKinney, continues to attract net migration from higher-cost metros, which supports medium-term price recovery.
For buyers relocating from outside Texas, Kamilashayehomes has a dedicated resource on moving to North Dallas that covers market comparisons and neighborhood selection in detail.
Key takeaways
Frisco’s home appreciation rate is currently negative at 4.2% year-over-year, but the city’s population growth, school quality, and employer base make it one of the strongest long-term real estate markets in North Texas.
| Point | Details |
|---|---|
| Current appreciation rate | Frisco median home value sits at $635,704, down 4.2% year-over-year as of february 2026. |
| Correction is supply-driven | New inventory outpaced buyer absorption; this is a reset, not structural market failure. |
| ZIP code variation is significant | Median prices range from $564,249 in 75036 to $667,986 in 75034 within the same city. |
| Long-term fundamentals are strong | A 127% price increase from 2013 to 2023 and 92% population growth underpin future appreciation. |
| Nearby markets provide context | Frisco’s correction is moderate compared to Austin and San Antonio, which fell 8%–12% from peak. |
Why I think buyers are reading this correction wrong
Most buyers I talk to see a 4.2% decline and assume they should wait for prices to fall further. That logic sounds reasonable. It rarely plays out the way people expect.
Frisco’s correction is slowing. The month-over-month drops went from nearly 2% in mid-2025 to under half a percent by early 2026. When a correction decelerates that clearly, the window for buying below peak closes faster than most buyers realize. By the time prices stabilize and the data confirms it, competition returns and negotiating leverage disappears.
The buyers who benefit most from corrections like this one are not the ones who wait for the absolute bottom. They are the ones who identify a neighborhood with durable demand, understand the school feeder zone, and move before the broader market catches on. In Frisco, that means looking hard at ZIP 75036 for entry-level value and the areas around 75034 for long-term appreciation potential tied to established infrastructure.
I also think the mortgage rate conversation is misunderstood. Rates at 7% feel painful, but they are also suppressing competition. When rates drop, buyers who were sitting out will flood back in. Prices will follow. Buying now with a plan to refinance later is a strategy worth modeling seriously, especially in a market with Frisco’s employment base.
For a granular look at how specific master-planned communities within the area are holding value, the Light Farms market analysis from Kamilashayehomes is one of the more data-grounded resources available right now.
— Felix
Find your next Frisco property with Kamilashayehomes
Kamilashayehomes specializes in Frisco, Prosper, and Celina, giving buyers and investors access to local market knowledge that goes well beyond what automated tools provide. Whether you are tracking current home prices in Frisco or ready to make an offer, Kamila Shaye’s team can walk you through neighborhood-level data, current inventory, and negotiation strategy tailored to where the market stands today. Browse current Frisco listings to see what is available at current price levels, or request a personalized home valuation to understand exactly where your target property stands in this market.
FAQ
What is the current Frisco home appreciation rate?
Frisco’s home appreciation rate is negative 4.2% year-over-year as of february 2026, with a median home value of $635,704. Prices have declined for 12 consecutive months from the March 2025 peak.
Is Frisco real estate still a good long-term investment?
Yes. Frisco median home prices rose 127% from 2013 to 2023, and the city’s population grew 92% between 2010 and 2023. Those fundamentals support long-term appreciation despite the current short-term correction.
Which Frisco ZIP code has the highest home values?
ZIP code 75034 carries the highest median home value in Frisco at $667,986, while 75036 offers the lowest entry point at $564,249, according to HousingData.report data from 2026.
How does Frisco’s price decline compare to other Texas cities?
Frisco’s 4.2% decline from peak is moderate compared to Austin and San Antonio, which saw corrections of 8%–12%. Frisco’s deeper demand base and employment anchors have cushioned the correction.
How many homes are selling in Frisco right now?
264 homes sold in Frisco in May 2026, up from 226 in May 2025. Rising sales volume alongside lower prices signals a market stabilizing rather than continuing to fall.